
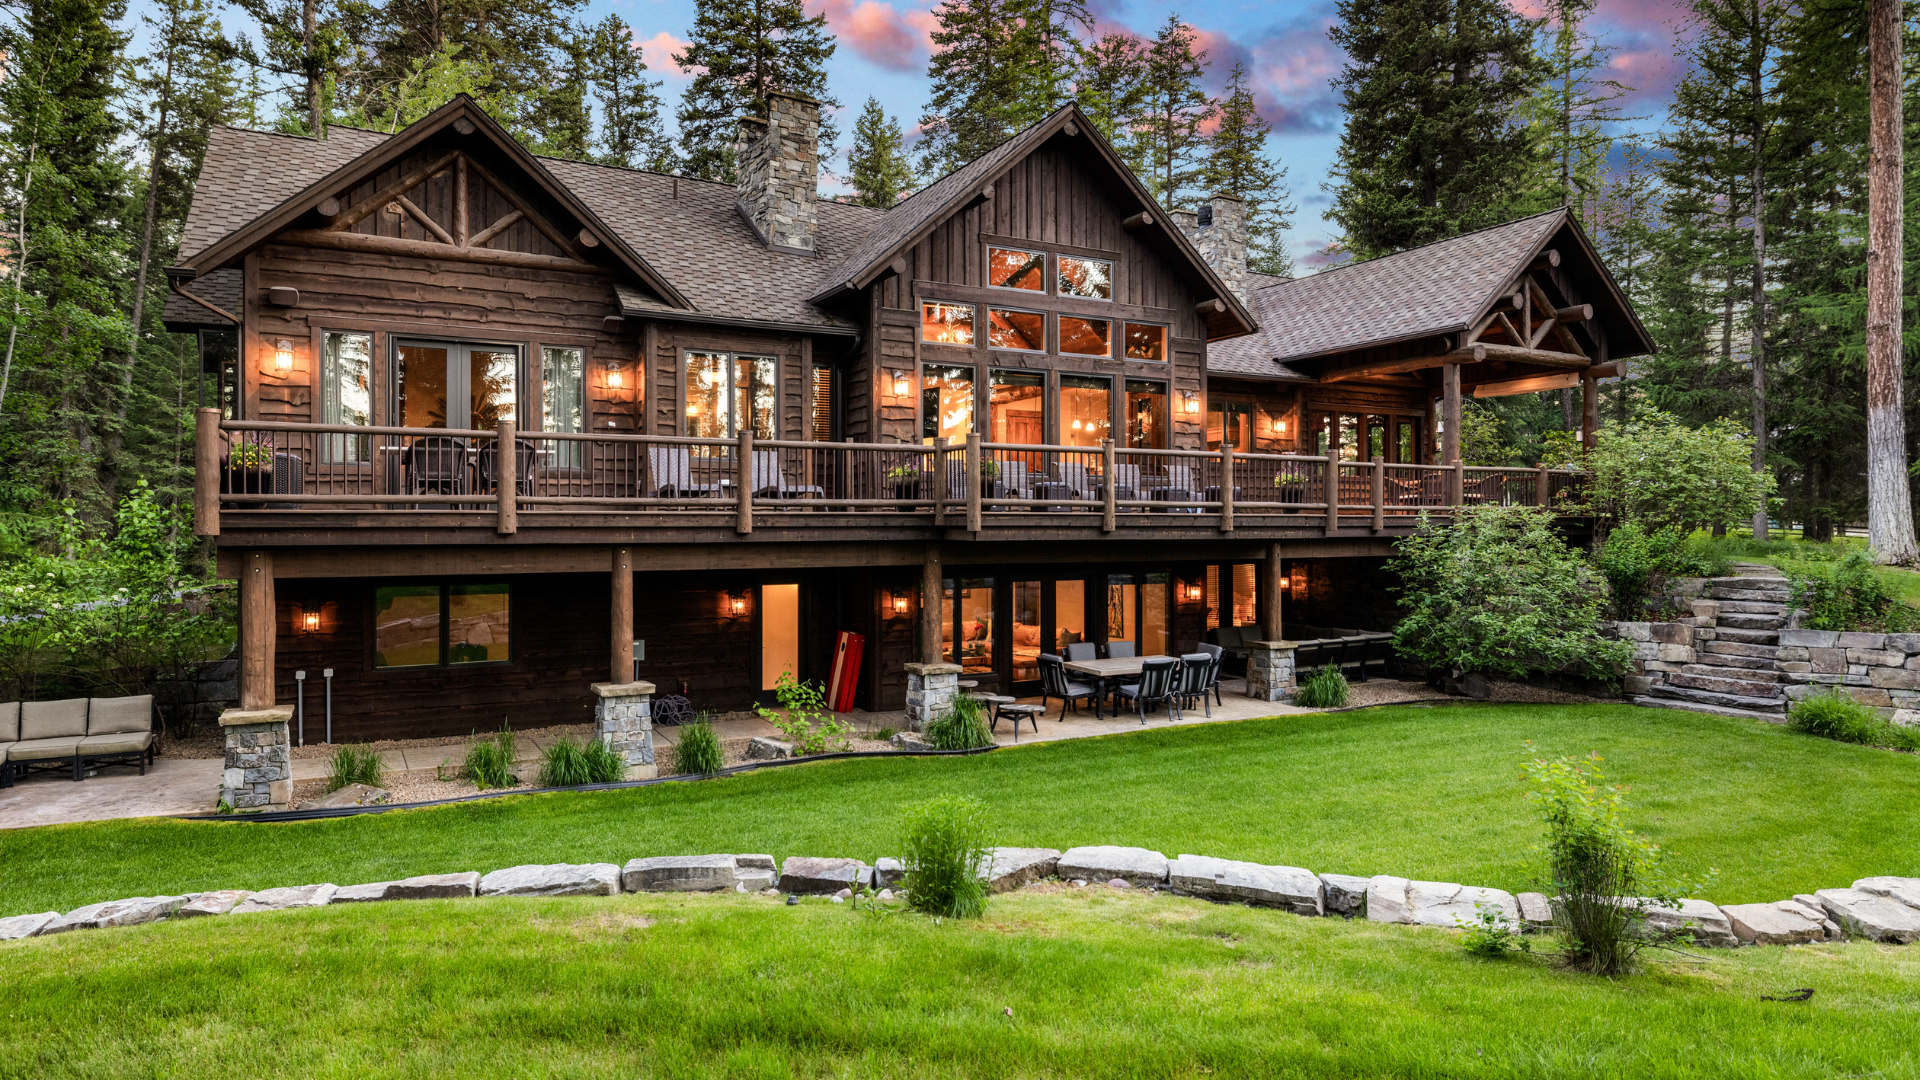
Welcome to the Q2 2026 Market Report—your trusted resource for staying current on residential real estate trends across Western Montana.
This edition covers key developments in Flathead, Missoula, and Lewis & Clark Counties. As the spring market transitions into summer, understanding recent market trends helps buyers and sellers make informed decisions with confidence. We’ve done the analysis so you can focus on what matters most: making confident, informed decisions—whether driven by lifestyle goals or long-term investment value.
Mobile Readers: Swipe left on the tables below to view all data.
Average Sales Price By County
| Average Sales Price | % Change (vs LQ/LY) | Median Sales Price | % Change (vs LQ/LY) | |
|---|---|---|---|---|
| Flathead | $951,795 | -1% / +4% | $640,000 | +4% / +2% |
| Missoula | $637,781 | +1% / -4% | $565,000 | +4%/ -2% |
| Lewis & Clark | $532,012 | +11% / +5% | $500,000 | +17% / +8% |
Across Western Montana, Q2 2026 pricing remained generally stable as the market moved through the heart of the spring selling season, with modest quarterly movement and relatively balanced year-over-year trends across Flathead, Missoula, and Lewis & Clark Counties. Flathead County continued to lead the region in overall pricing while maintaining remarkable stability, Missoula County experienced only minor shifts despite increased market activity, and Lewis & Clark County posted the strongest quarterly gains as demand strengthened. Overall, county-level trends suggest pricing has remained resilient even as inventory and transaction volume increased.
Average Sales Price by Town
| Average Sales Price | % Change (vs LQ/LY) | Median Sales Price | % Change (vs LQ/LY) | |
|---|---|---|---|---|
| Whitefish | $1,689,710 | -7% / +4% | $965,000 | -16% / -1% |
| Kalispell | $690,531 | +7% / flat | $568,000 | +7% / +1% |
| Bigfork | $1,149,977 | +6% / +1% | $819,000 | -2% / +11% |
| Missoula | $614,544 | -5% / -7% | $556,655 | +3% / -3% |
| Helena | $538,329 | +12% / +1% | $505,000 | +18% / +7% |
At the town level, Q2 2026 reflected healthy but varied pricing trends across Western Montana’s core markets. Whitefish remained the region’s premier luxury market despite modest quarterly moderation following a strong first quarter. Kalispell continued to demonstrate steady demand with gains in both average and median pricing, while Bigfork’s results reflected the influence of changing sales mix typical of a smaller luxury market. Missoula remained relatively balanced despite slight year-over-year softening, and Helena posted notable quarterly gains that reinforce its steady market fundamentals. Collectively, these trends suggest demand remains healthy across the region as buyers continue to absorb available inventory.
Price Per Square Foot By County
| Average PPSF | % Change (vs LQ/LY) | Median PPSF | % Change (vs LQ/LY) | |
|---|---|---|---|---|
| Flathead County | $422 | -1% / -1% | $361 | +4% / +5% |
| Missoula County | $334 | flat / -4% | $319 | +5% / -3% |
| Lewis & Clark County | $279 | +6% / flat | $272 | +7% / +2% |
Price per square foot remained relatively stable across Western Montana in Q2 as the market experienced stronger seasonal activity. Flathead County continued to command the highest PPSF in the region while maintaining consistency from both the previous quarter and last year. Missoula County saw only modest movement despite increased sales activity, while Lewis & Clark County recorded moderate quarterly gains. Overall, PPSF trends continue to support a market where underlying property values remain steady even as inventory and buyer activity increase.
Price Per Square Foot By Town
| Average PPSF | % Change (vs LQ/LY) | Median PPSF | % Change (vs LQ/LY) | |
|---|---|---|---|---|
| Whitefish | $603 | -12% / -3% | $517 | -12% / +1% |
| Kalispell | $340 | +6% / +33% | $334 | +8% / +4% |
| Bigfork | $427 | -20% / +10% | $439 | +6% / +16% |
| Missoula | $335 | -1% / -4% | $322 | +5% / -2% |
| Helena | $276 | +5% / +3% | $269 | +6% / -4% |
At the town level, PPSF trends in Q2 highlighted continued variation across Western Montana’s individual markets. Whitefish experienced modest quarterly moderation following exceptionally strong pricing earlier in the year, while Kalispell posted notable gains that reflect continued demand for in-town housing. Bigfork remained more variable, consistent with its smaller luxury market and changing mix of waterfront and high-end sales. Missoula continued to show steady pricing, while Helena maintained gradual appreciation and overall market stability. Together, these trends suggest pricing remains healthy across the region despite normal fluctuations between communities.
Supply & Demand
| Average Days on Market | % Change (vs LQ/LY) | |
|---|---|---|
| Flathead County | 99 | -23% / -6% |
| Missoula County | 84 | -22% / +15% |
| Lewis & Clark County | 79 | -19% / -3% |
| Whitefish | 103 | -24% / +24% |
| Kalispell | 99 | -16% / -11% |
| Bigfork | 83 | -42% / -31% |
| Missoula | 84 | -21% / +31% |
| Helena | 79 | -20% / +1% |
As Western Montana moved through the spring market, homes generally sold more quickly than they did during the first quarter, reflecting stronger seasonal buyer activity and increased demand. Days on market declined across every county and town compared to last quarter, with several communities seeing substantial improvements in market pace. While year-over-year comparisons varied by location, well-priced homes continued to attract buyers quickly throughout much of the region. Overall, days-on-market trends point to an active and competitive market through the summer selling season.
Homes For Sale
| New Listings | % Change (vs LQ/LY) | Closed Sales | % Change (vs LQ/LY) | |
|---|---|---|---|---|
| Flathead County | 983 | +60% / -3% | 500 | +68% / +14% |
| Missoula County | 661 | +47% / -7% | 409 | +83% / +18% |
| Lewis & Clark County | 406 | +54% / -9% | 259 | +45% / +8% |
| Whitefish | 209 | +35% / -20% | 103 | +69% / +29% |
| Kalispell | 482 | +60% / +11% | 266 | +69% / +11% |
| Bigfork | 107 | +75% / -19% | 45 | +36% / +32% |
| Missoula | 506 | +33% / -11% | 338 | +75% / +21% |
| Helena | 322 | +66% / -5% | 197 | +34% / +15% |
Q2 activity reflected the seasonal acceleration that typically accompanies Western Montana’s spring to summer market, with new listings and closed sales increasing sharply from the previous quarter across nearly every market. While year-over-year listing activity remained mixed, closed sales outpaced last year’s levels throughout the region, indicating healthy buyer demand despite additional inventory coming online. For buyers, the increase in available homes created more opportunities, while sellers continued to benefit from strong market activity when pricing appropriately. Overall, these trends point to a market that remains active, balanced, and well-positioned as the busy summer season begins.
So What?
What This Means for Buyers
As the market moves into the busy summer season, buyers are seeing more opportunities without a meaningful loss of market stability. Inventory has expanded from the spring, giving buyers more choices, while pricing has remained relatively steady across much of Western Montana. This creates opportunities for buyers to:
- Take advantage of a larger selection of available homes
- Compare options more carefully while inventory remains elevated
- Find value in markets where pricing has remained stable despite increased activity
Well-priced homes continue to attract attention, but the increase in available inventory provides buyers with greater flexibility than earlier in the year.
What This Means for Sellers
For sellers, the summer market continues to reward preparation, competitive pricing, and strong presentation. Buyer activity remains healthy throughout Western Montana, with closed sales increasing across every county compared to both last quarter and last year. Successful sellers are:
- Pricing accurately from the start based on current market conditions
- Paying close attention to presentation, condition, and marketing
- Taking advantage of increased buyer activity while remaining realistic in competitive markets
Homes that are well-prepared and priced appropriately continue to perform well, even as buyers enjoy more options than they did earlier in the year.
The Big Picture
Overall, the second quarter points to a market that is continuing to normalize rather than dramatically shift. Buyers have more options than they did in recent years, while sellers who price strategically are still seeing strong results. Although trends vary by county and price point, Western Montana remains a healthy market supported by steady demand and improving inventory.
